How GTM Teams Forecast Expansion Revenue Using Product Telemetry
By QuadSci Team
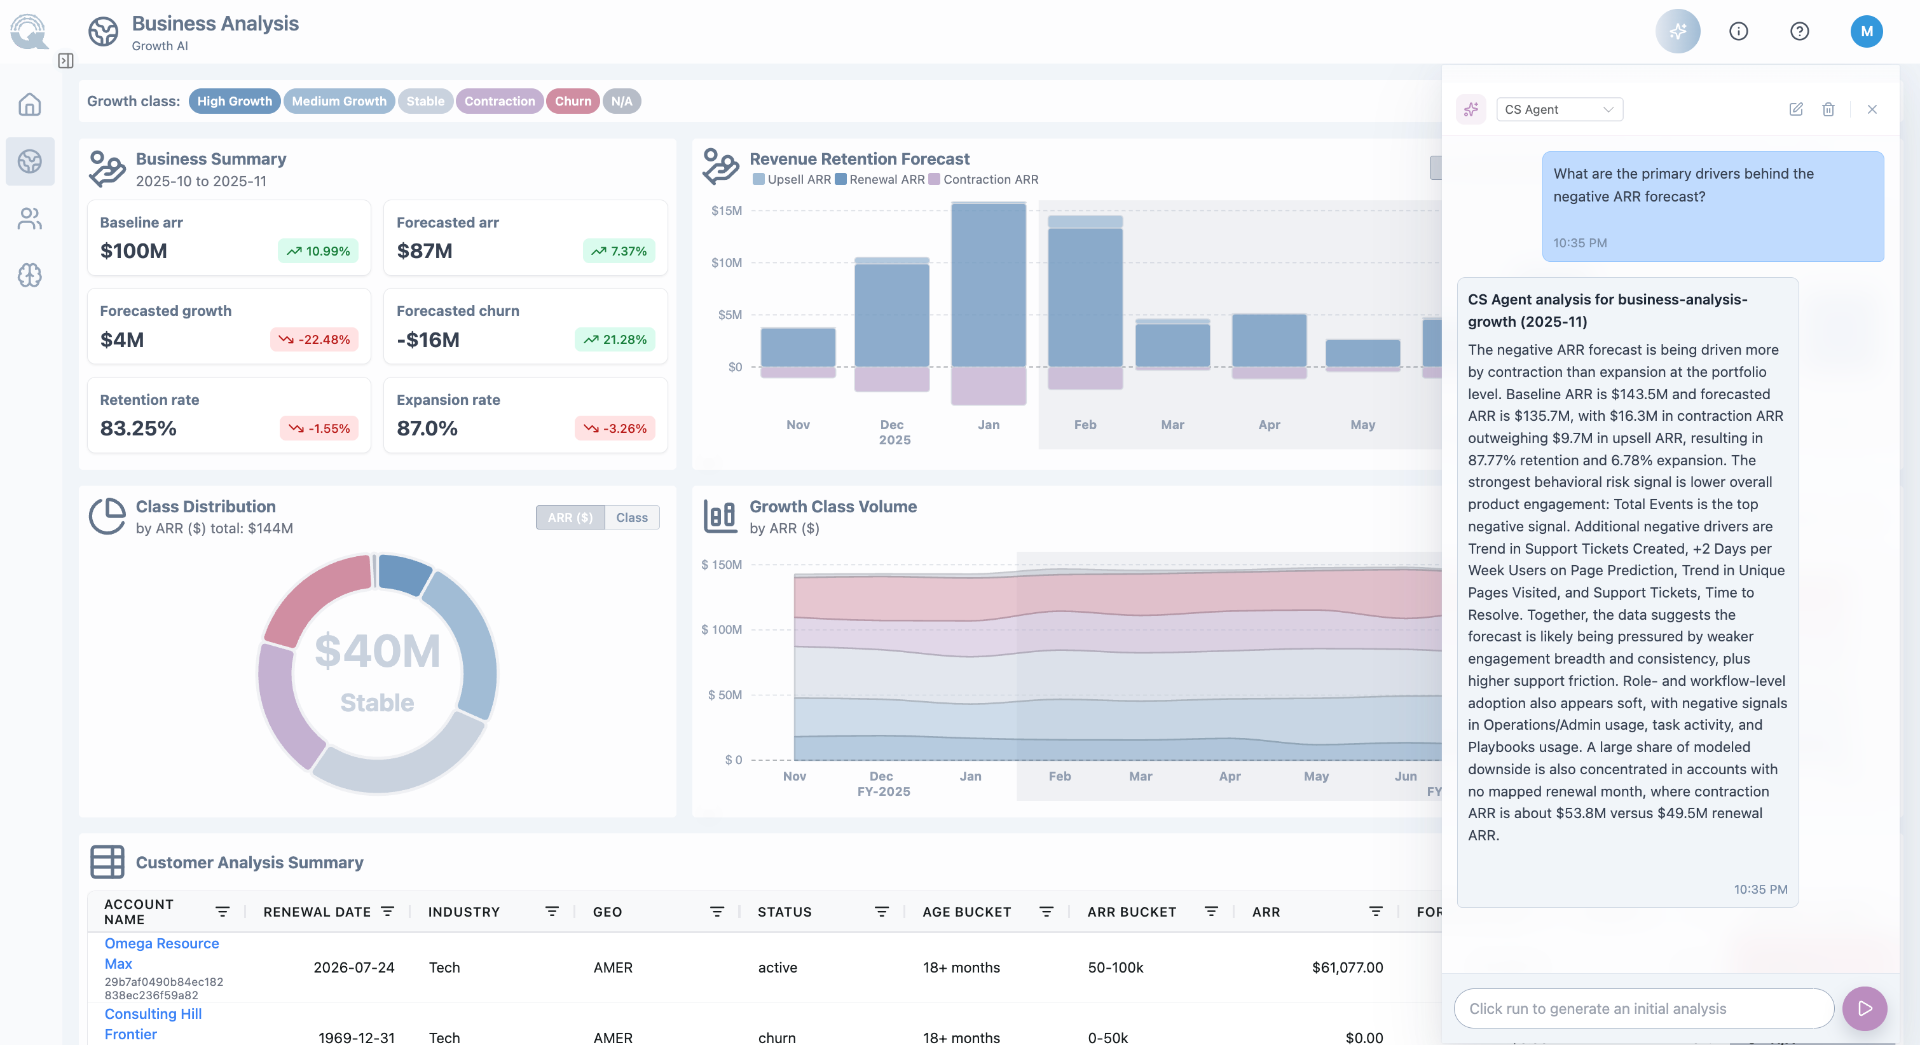
Most expansion revenue is already visible in your product data. The problem is that most teams are not reading it until it is too late to act on it.
GTM teams can forecast expansion revenue by identifying behavioral signals in product telemetry that precede upsell and cross-sell events: feature adoption acceleration, integration depth, API usage growth, and user expansion into new workflows. These signals appear 9 to 18 months before a commercial opportunity matures. QuadSci's Growth AI ingests telemetry at scale, scores accounts for expansion probability, and surfaces forecasts directly inside CRM and revenue execution tools. On average, QuadSci finds 15% of ARR sitting unpiped in behavioral data that CRM-only approaches miss entirely.
Why CRM-Only Expansion Forecasting Fails
Most sales and RevOps teams forecast expansion the same way they forecast new business: from CRM activity. Opportunity stage. Meeting cadence. Rep-logged notes. Renewal date proximity. These inputs describe what has already happened in the commercial relationship. They tell you nothing about what is happening inside the product, where the actual evidence of expansion readiness lives.
The result is a forecasting model built entirely on lagging indicators. By the time a CSM logs that a customer has asked about additional seats, or a rep notes that an account is using a feature they have not paid for, the expansion opportunity has been visible in the product data for months. CRM-only teams discover opportunities when customers surface them. Telemetry-driven teams discover them first.
CRM-only (lagging) vs. telemetry-driven (leading)
Customer asks about pricing for more seats. Usage data shows user count approaching tier limit 90 days earlier.
Rep notes feature usage in call recap. Feature adoption acceleration visible in telemetry 60 days before the call.
Renewal conversation surfaces expansion interest. Integration depth signals expansion readiness 9-18 months before renewal.
QBR reveals adoption gaps. Behavioral cohort analysis identifies the gap before the QBR is scheduled.
The Telemetry Signals That Predict Expansion
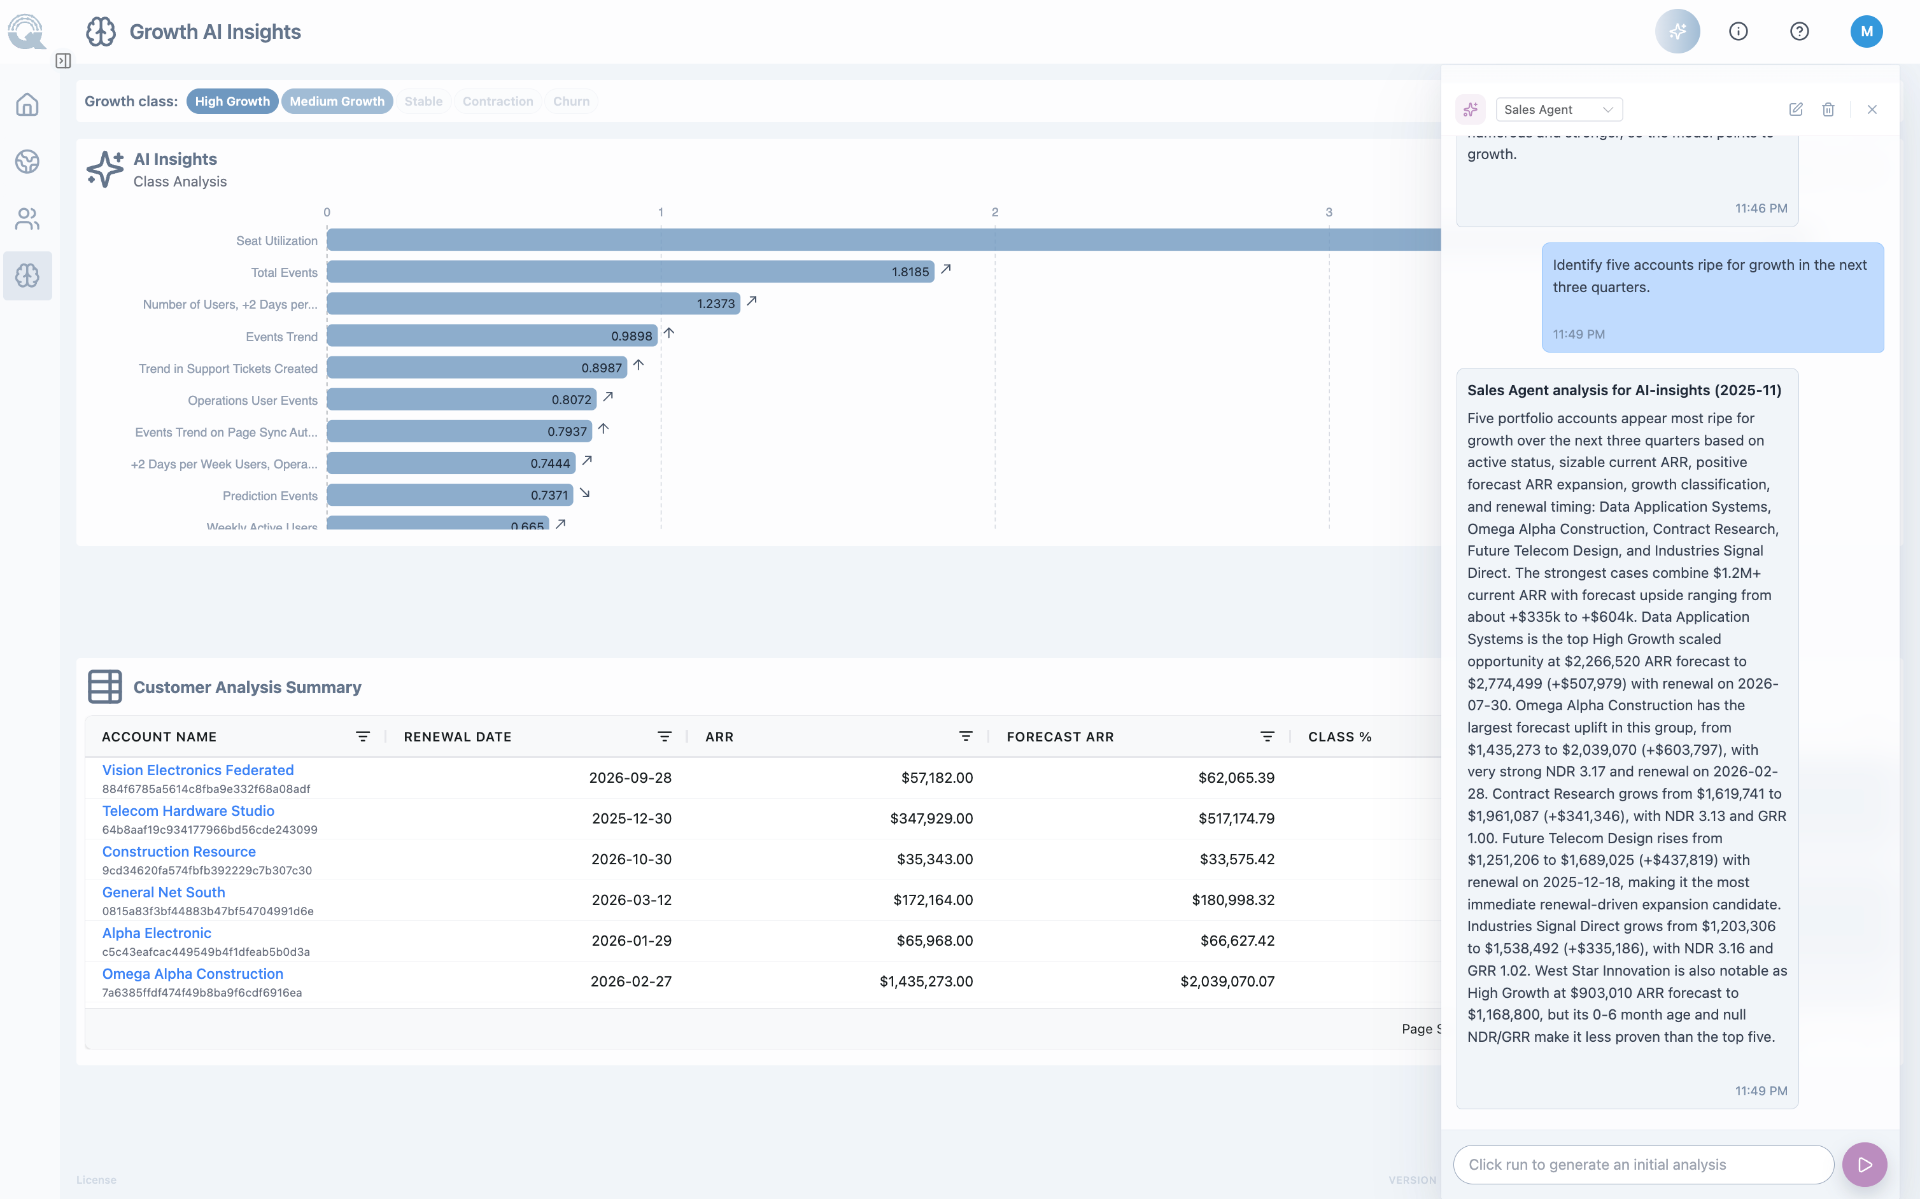
Not all product behavior is equally predictive of expansion. The signals that most reliably precede an upsell or cross-sell event fall into four categories.
Feature adoption acceleration. When a customer who has been using a core feature at a steady rate begins accelerating their usage, or when they begin exploring adjacent features they have not used before, they are signaling that the product is delivering value and they are ready for more. This is one of the earliest and most reliable expansion signals.
Integration depth and system-to-system activity. Customers who embed your product into their operational workflows through integrations, API connections, and automated data pipelines are demonstrating a level of product dependency that is both a retention signal and an expansion signal. As that integration activity grows, so does the likelihood that adjacent use cases will emerge.
User expansion into new departments or roles. When a product that was originally deployed for one team begins generating activity from users in other functions, that cross-functional adoption precedes formal expansion requests. The new users are already getting value before anyone in the commercial relationship has named it as an opportunity.
Consumption trajectory relative to contract limits. Customers whose usage is trending toward the limits of their current contract tier are expansion candidates by definition. Telemetry makes this visible months before the limit is breached, rather than at the point of renewal when the conversation has become reactive.
The Workflow: From Telemetry to Expansion Forecast
The workflow QuadSci enables for GTM teams follows a consistent structure across all four signal types.
Telemetry ingestion. QuadSci connects to the systems generating behavioral data across the customer base: product analytics platforms, API observability tools, integration platforms, CRM, and data warehouses. This includes both front-end UI and UX events and back-end system-to-system API calls. The platform has analyzed 11 trillion telemetry events to train its predictive models.
Behavioral signal scoring. Incoming telemetry is scored against models trained on historical behavioral patterns across comparable accounts. The models identify which combinations of signals, and at what rate of change, are predictive of expansion events for this specific product. The output is an account-level expansion probability score with the behavioral evidence behind it.
Expansion revenue forecast. Growth AI produces an account-level ARR forecast grounded in behavioral trajectory, not CRM activity. Accounts showing strong expansion signals are surfaced as pipeline with a predicted revenue range and a confidence score. On average, 15% of ARR that goes unforecasted in CRM-only models is visible in QuadSci's behavioral data.
Action delivery. The forecast and the underlying signal surface inside Salesforce, Gainsight, Clari, Salesloft, Gong, and Slack via QuadSci's native integrations and MCP Server. Revenue teams receive account-specific next best actions tied to each expansion signal, without needing to leave the tools where they already work.
Accuracy and Lead Time
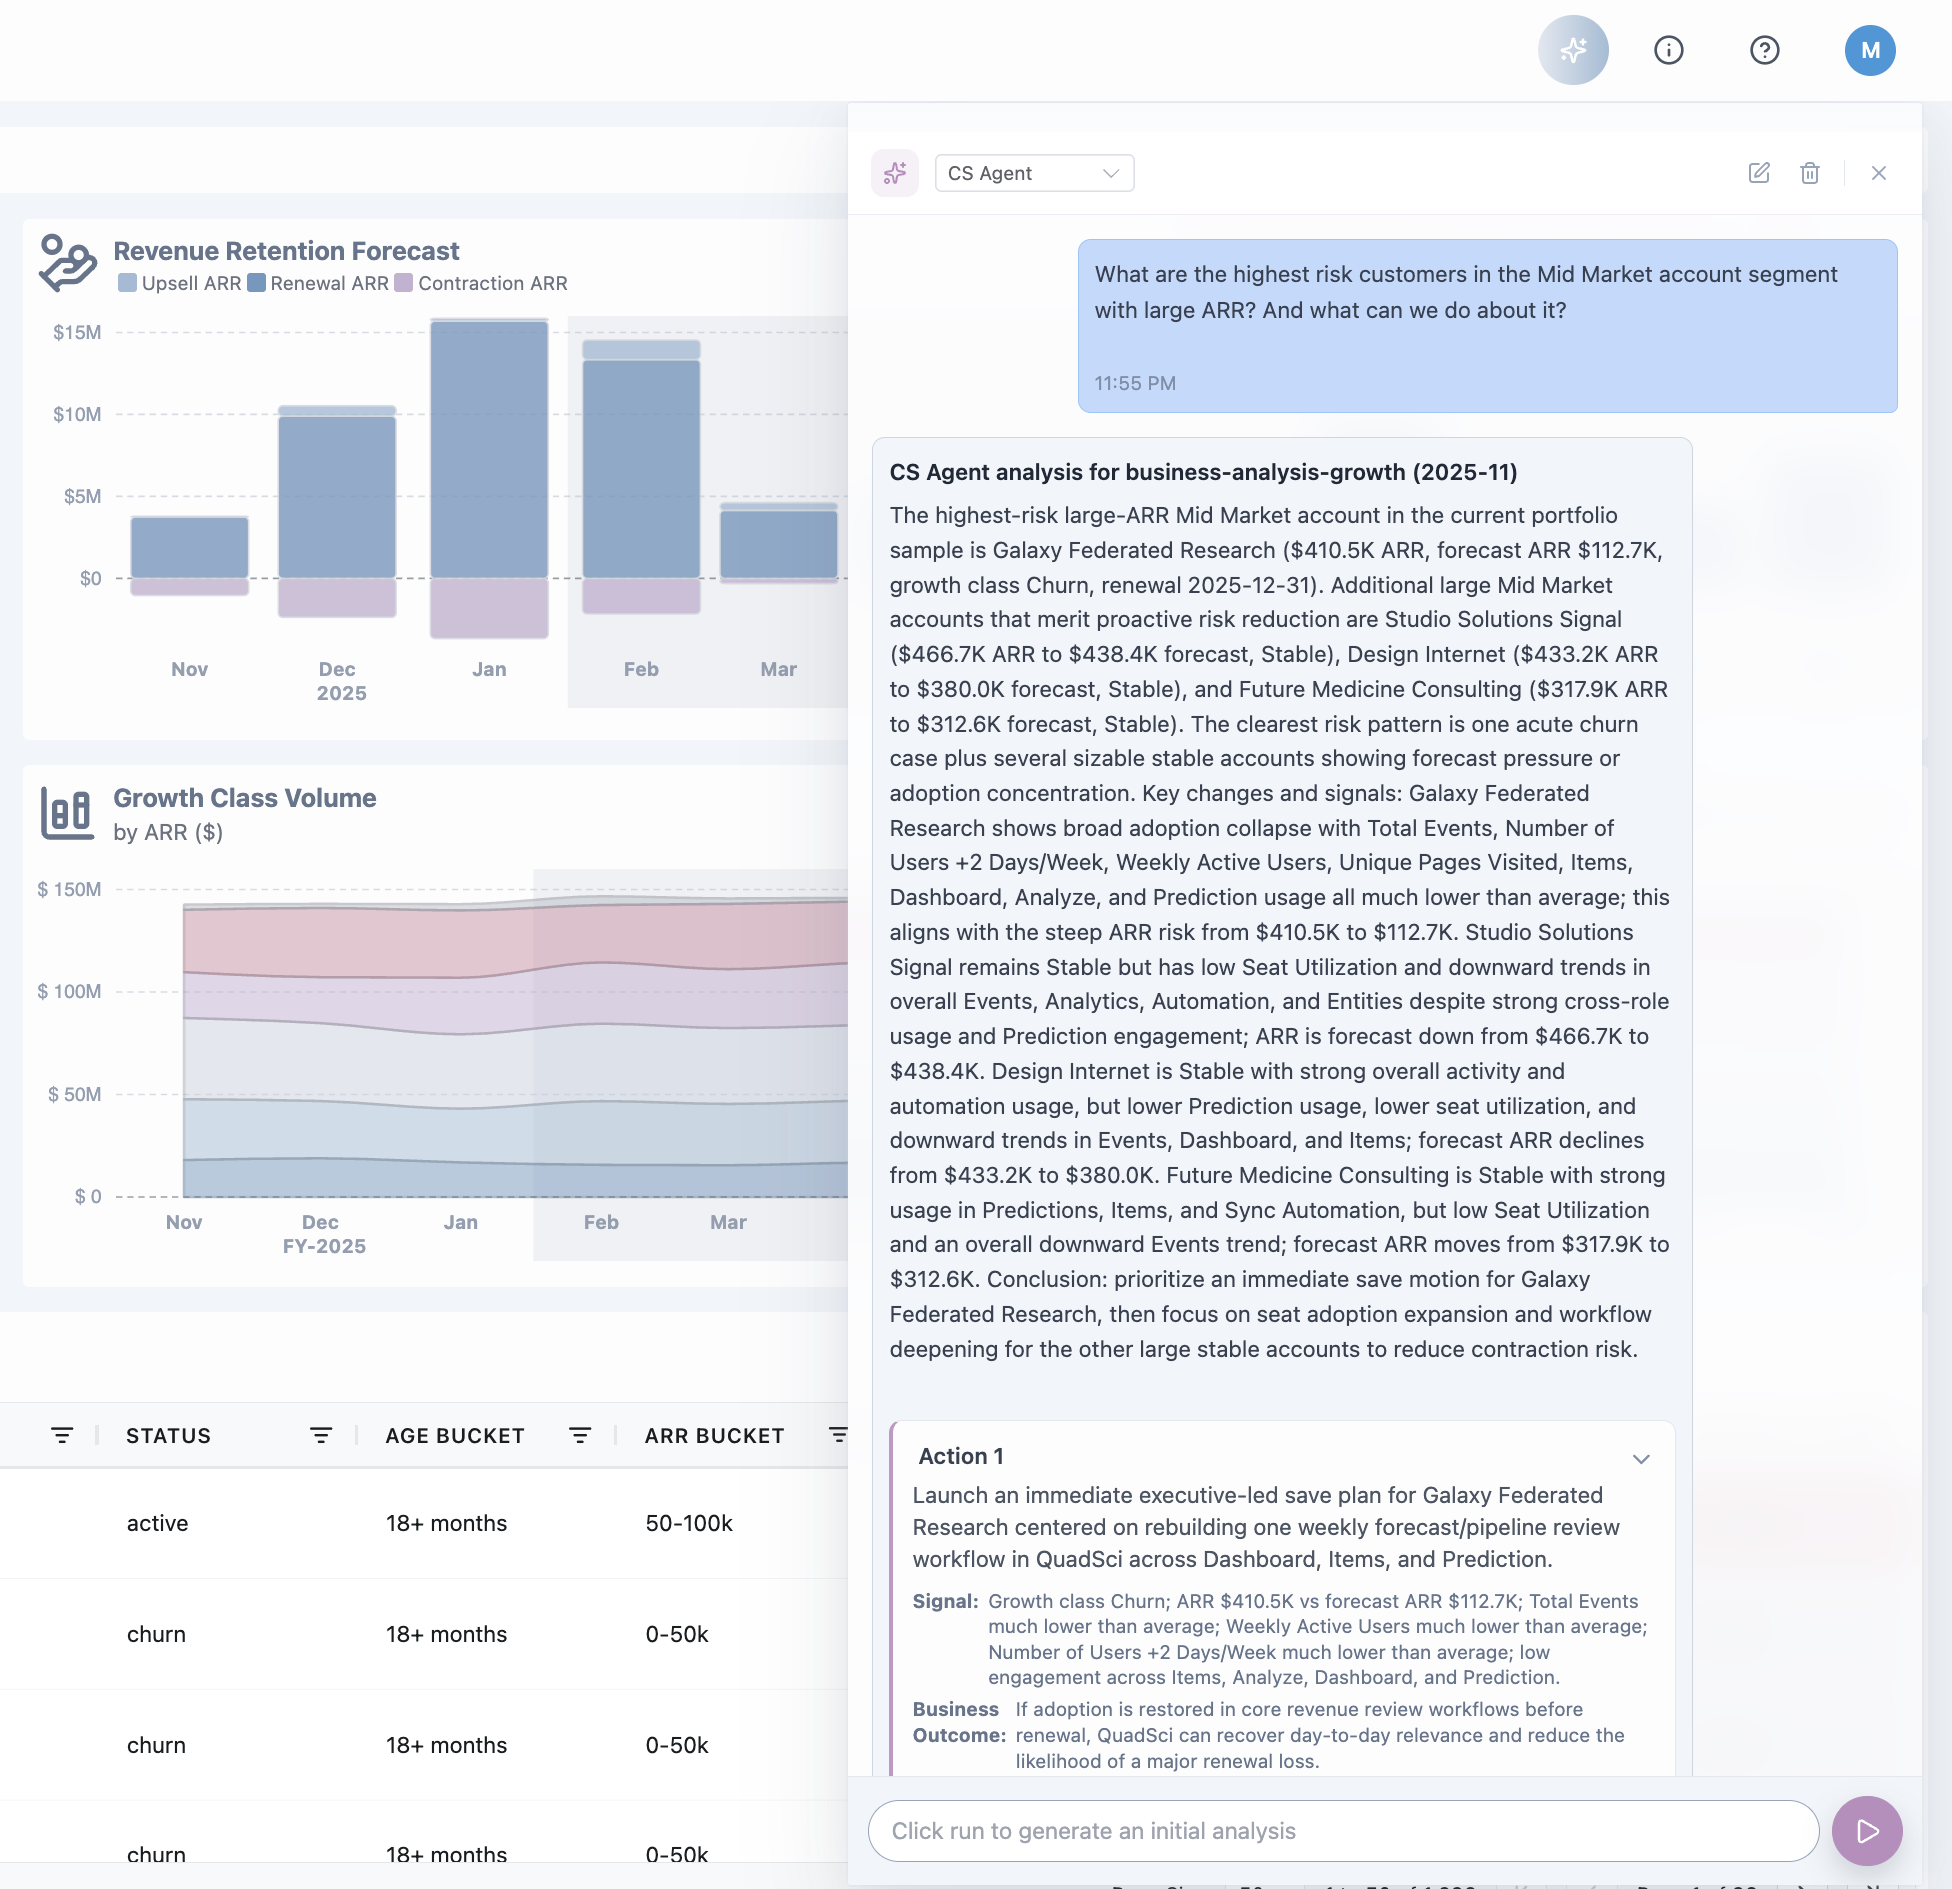
The value of telemetry-driven expansion forecasting is not only in the accuracy of the prediction but in when it arrives. QuadSci delivers 90% predictive accuracy for churn and growth events, with signals available 9 to 18 months in advance of the event.
For expansion forecasting specifically, that lead time means GTM teams can build pipeline from signals that are already present in the product data, long before a customer surfaces the need in a renewal conversation. A CSM or AE with 9-18 months of lead time can build the relationship, close the adoption gaps, and frame the commercial conversation in a way that a team with 30 days of lead time cannot.
This is also why the accuracy figure matters. A 90% accurate signal with 9-18 months of lead time is a planning input. A lower-confidence signal with shorter lead time is a flag to monitor. The combination of accuracy and horizon is what makes telemetry-driven forecasting operationally useful rather than just analytically interesting.
What This Means for RevOps
For RevOps teams, telemetry-driven expansion forecasting changes two things.
First, it changes the composition of the expansion pipeline. Rather than a pipeline built entirely from rep-sourced opportunities and renewal upsell conversations, it includes a systematic layer of behavior-sourced accounts that have already demonstrated expansion readiness in the product. That pipeline is more predictable and more defensible in a board or leadership context because it is grounded in evidence, not commercial intuition.
Second, it changes how capacity is allocated. When expansion signals are visible 9 to 18 months in advance, RevOps can direct CSM and AE attention toward the accounts most likely to expand before those accounts have been identified through the CRM. That proactive allocation produces better conversion rates and better use of commercial capacity than reactive prioritization.
Getting Started
The starting point for most GTM teams is a signal gap assessment: an audit of which expansion signals are currently visible in existing tools versus which are present in the behavioral data but not surfaced anywhere in the commercial workflow.
QuadSci connects to the systems most revenue teams already use and surfaces the gap within weeks. The 50-plus integrations in the platform are designed to make the behavioral layer accessible without replacing the existing stack.
Learn more about Growth AI, or see how this maps to the Drive Expansion Revenue solution.
See where your expansion revenue is already sitting unpiped
Growth AI classifies every account by revenue trajectory each month and ranks expansion opportunities by ARR potential, so your GTM team can act on product-qualified expansion signals before they show up on a renewal call.